

Academic Publishing's $28 Billion Business Model (Part 1)
This is Part 1 of a two-part series. Part 2, “The Damage, the Defections, and What Comes Next,” covers the library crisis, the reform movements, and the structural obstacles they face.


The researchers write the papers. Other researchers review them for free. Universities pay billions to read them. And the publishers, who created none of it, pocket margins that make Apple look modest.
Imagine a platform where millions of highly educated professionals produce all the content, perform all the quality control, and then pay to distribute their work. A handful of corporations collect the money from both ends and share none of it with anyone. Now imagine that those professionals have no real choice in the matter, because their entire career depends on continuing to feed the machine.
This is not a hypothetical. It is the business model of academic publishing, and it has been running without serious interruption since the 1970s.
Part 1: The Machine (Who Does What, Who Gets Paid)
To understand why this system is extraordinary, you first need a map of who does what.
The researchers (authors) conduct the science, typically paid by universities, government grants, or research institutes, almost all of which are funded by taxpayers. They write the paper, usually over months or years. They format it to a journal’s specific requirements. They revise it after peer review. They sign over copyright to the publisher. They receive no payment from the journal.
The peer reviewers are other researchers (usually two to four per paper) who read the manuscript, check the methods, challenge the conclusions, and write detailed critiques. This takes an average of 5–8 hours per review. They receive no payment from the journal. (A handful of journals offer token honoraria of $50–$100, which amounts to $6–$20/hour for expert-level scientific evaluation.)
The editors at most commercial journals are either unpaid academic volunteers serving as handling editors, or in the case of senior editors at high-prestige journals, salaried employees of the publisher. At society-run journals, editors are typically academics receiving modest stipends or none. The substantive intellectual gatekeeping (deciding what is and isn’t worth reviewing) is done largely by unpaid academic labor.
The publisher handles layout, digital hosting, DOI assignment, and metadata management. It runs the submission platform, employs a sales force to negotiate institutional subscriptions, and lobbies funders and governments on policy questions.
The university library pays the publisher an annual subscription fee, ranging from thousands to tens of millions of dollars depending on the package, so that its faculty and students can read the content those same faculty helped produce.
The reader outside a university who wants to read a single paper pays $30–$50 per article, or is locked out entirely.
The money flows from all three directions toward the publisher. None of it reaches the people who did the work.
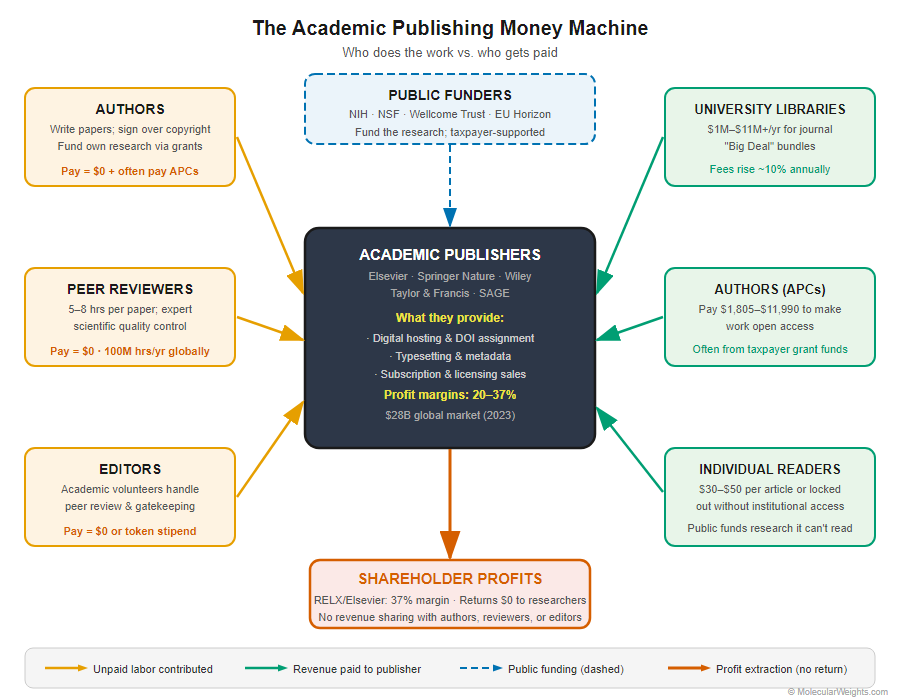
Figure 1. The academic publishing ecosystem showing who produces each form of value (orange = unpaid academic labor), who pays (blue = funding flows), and who captures revenue (green = publisher). Taxpayer-funded research generates the raw content; peer reviewers and editors provide quality control at no cost to publishers; universities pay again for subscription access. The publisher sits at the center of all three flows.
Part 2: The Numbers Are Staggering
The sums involved are not modest.
The Big Five and Their Margins
Five companies (Elsevier, Springer Nature, Wiley, Taylor & Francis, and Sage) publish more than 50% of all peer-reviewed scientific literature globally. In 1973 their combined share was about 20%. By 2013, that figure had grown to over 50%, and the concentration has continued since.1
The profit margins are remarkable:
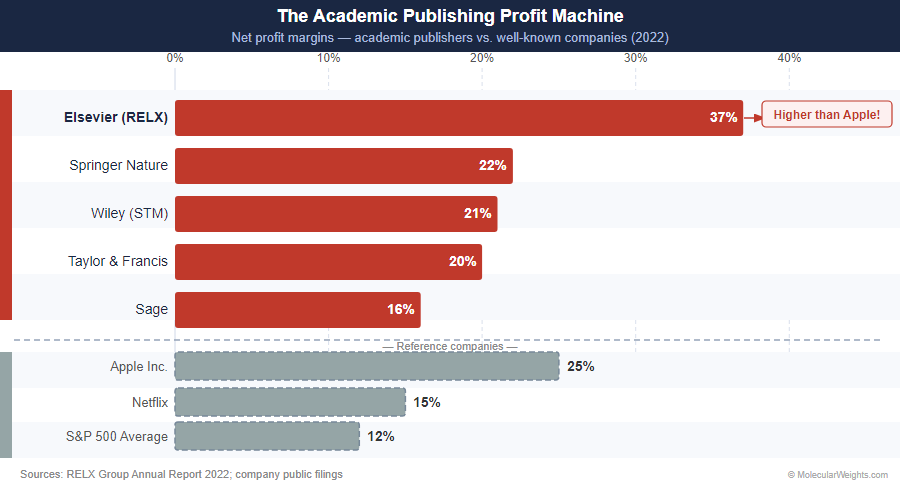
Table 1. Net profit margins for the Big Five academic publishers compared with Apple, Netflix, and the S&P 500 average
For context: the pharmaceutical industry, frequently cited as a high-margin sector, averages around 15–20% net margins. The average S&P 500 company earns about 12%. Elsevier’s 37% margin has been sustained for years, described in the company’s own annual reports and independently confirmed by multiple analyses.2,3
A 2019 analysis in Science noted: “The big three — Elsevier, Springer Nature, and Wiley — made US$3.2, US$1.9, and US$1.7 billion in revenue in 2017, respectively, with Elsevier banking 37% of revenue as profit.”3
These profits come from two revenue streams: subscription fees charged to libraries and, increasingly, article processing charges (APCs) paid by authors for open access publication.
The APC Gold Rush
A 2023 study in Quantitative Science Studies by Leigh-Ann Butler and colleagues estimated that globally, authors paid $1.06 billion in article processing charges to the Big Five publishers between 2015 and 2018 alone. That was before APC prices began accelerating.4
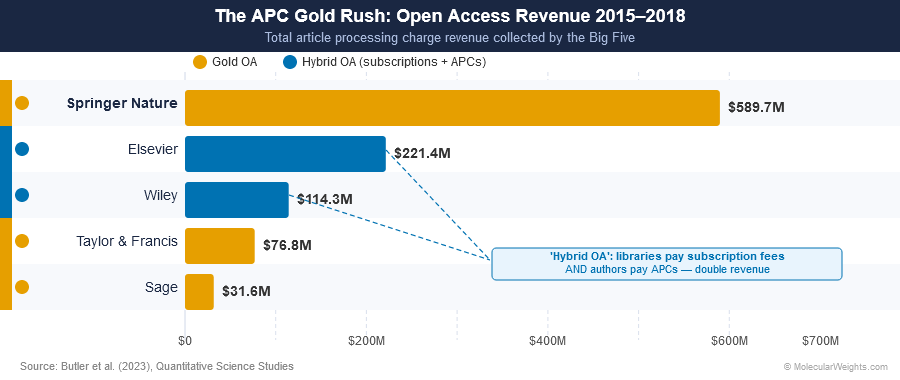
Table 2. Total open-access article processing charge (APC) revenue collected by the Big Five publishers, 2015-2018. Gold OA = author pays APC; Green OA = free after embargo
“Hybrid” OA means the journal still charges libraries a subscription and charges authors an APC to make their specific paper free, sometimes called “double dipping.” The publishers collect from both ends simultaneously.
What Do APCs Actually Cost?
Here are current (2024–2025) APC fees at major journals, mostly in the hard sciences:
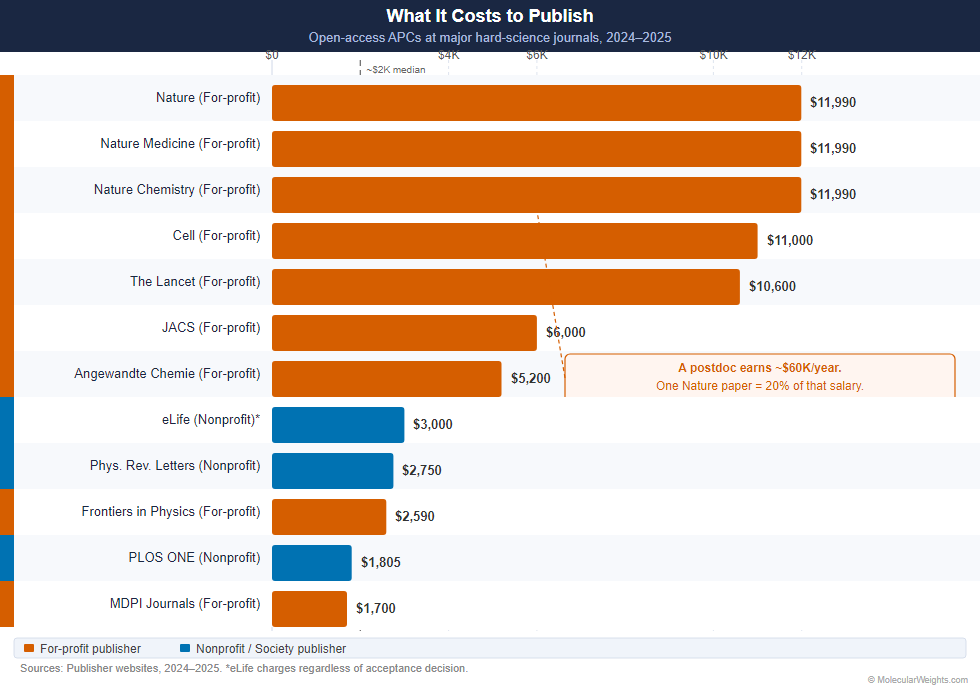
Table 3. Open-access article processing charges (APCs) at major hard-science journals, 2024-2025. Orange bars = for-profit publishers; blue bars = nonprofit/society publishers. *eLife moved to a “publish then review” model in 2023, charging $3,000 regardless of final decision.
The Lancet’s APC of $10,600 to publish a single paper publicly carries a steep cost. A postdoctoral researcher’s annual salary at many US institutions is around $55,000–$65,000. Publishing one open-access paper in that journal costs roughly 15–20% of their annual salary, paid to the publisher rather than to the researcher.
In fields like chemistry and physics where multiple papers per year is expected, the cumulative APC burden on grant budgets is substantial.
APC Inflation Is Outrunning General Inflation
A 2019 analysis in LIBER Quarterly by Khoo found that increases in APCs were proceeding at three times the rate that would be expected if APCs tracked general inflation.5 This mirrors the earlier serials crisis, where subscription costs rose at 8–12% annually even as library budgets stagnated or shrank.
The open-access “solution” that publishers embraced was not really a solution. It was a migration of the same extraction logic from libraries to grant budgets.
Part 3: The Peer Review Economy (100 Million Free Hours)
The intellectual beating heart of academic publishing is peer review: the process by which other scientists evaluate a manuscript before it is published. Without this labor, journals would have nothing to sell.
A landmark 2021 study in Research Integrity and Peer Review by Aczél and colleagues made the hidden economy of peer review visible for the first time at scale.6
Across approximately 1.7 million papers published in 2020, they estimated:
Total peer review hours globally: over 100 million
That is equivalent to over 15,000 person-years of full-time labor
Estimated monetary value of US-based reviewer time: $1.5 billion USD
China-based reviewers: $600 million USD
UK-based reviewers: close to $400 million USD
The authors note their estimates are “very likely to be under-estimates” because they reflect only a portion of all journals worldwide.
None of this labor is compensated by publishers. The $2.5+ billion in reviewer labor value in the US, China, and UK alone (performed in a single year) flows into the publisher’s product at zero cost.
“The numbers highlight the enormous amount of work and time that researchers provide to the publication system,” Aczél et al. write, “and the importance of considering alternative ways of structuring, and paying for, peer review.”6
The analogy to content creation is apt here. YouTube does not pay for the videos people watch; creators do. But YouTube shares advertising revenue with creators. Twitch pays streamers. Academic publishers extract peer review labor, derive direct commercial value from it, and pay nothing in return.
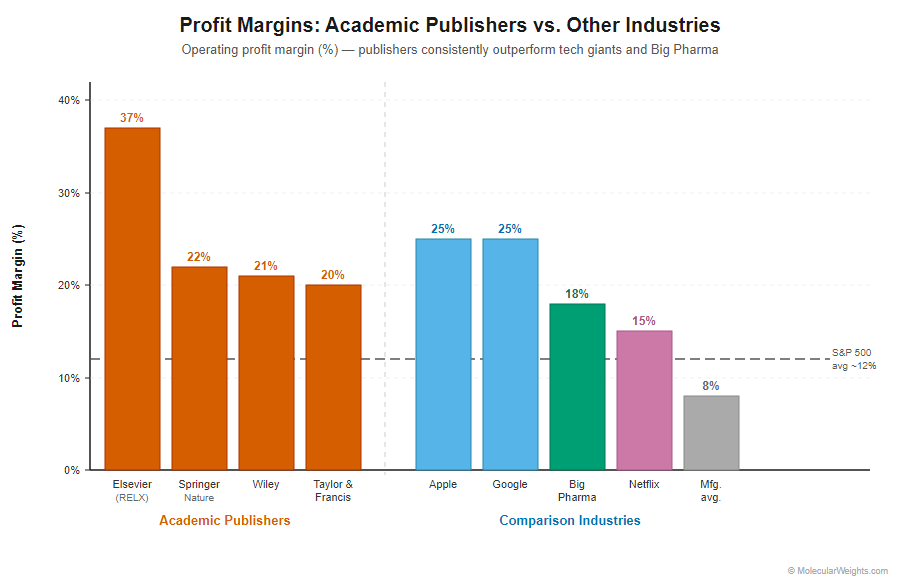
Figure 2. Elsevier’s 36–37% profit margin sits above Apple, Google, major pharmaceutical companies, and Netflix. These margins are sustained partly because the core intellectual content (manuscripts, peer review, editorial decisions) is provided at no cost by publicly funded academics. Sources: RELX Group annual reports; Eddy 2019 (Science); Larivière et al. 2015 (PLOS ONE).
Part 4: The Impact Factor, A Metric That Ate Science
To understand why researchers continue feeding a system that extracts so much from them, you need to understand the impact factor, the single number that controls academic careers more than any hiring committee, grant panel, or peer assessment.
What It Is
The impact factor (IF) for a given journal is calculated annually by Clarivate (formerly Thomson Reuters). It equals the number of citations received in the current year to papers published in that journal in the previous two years, divided by the number of citable papers published in those two years.
A journal with an IF of 10.0 means that, on average, each paper it published over the past two years received 10 citations in the current year.
The concept was created by information scientist Eugene Garfield in the 1950s as a tool to help librarians identify which journals were being cited most, a collection management tool, not a research quality metric. As a 2025 editorial in the BMJ put it: “The impact factor was originally intended by Garfield to be a tracking device and a retrieval tool… However, since then it has been repeatedly used to assess the quality of authors’ research, particularly for purposes of funding and awarding tenure, against Garfield’s advice that this was not a legitimate use.”7
How It Warped Science
When the IF became the proxy for scientific quality, it created incentives that now define research careers:
Publish in high-IF journals above all else. A paper in Nature (IF ~65) counts far more toward promotion than three papers in solid specialty journals with IFs of 3–5, regardless of actual scientific impact.
Chasing the hot topic. Work likely to generate quick citations because it is trendy, controversial, or broadly applicable, gets preferred over careful, foundational work.
Review inflation. Studies have documented systematic gaming of IF through citation cartels, coercive self-citation requests from editors, and strategic citation practices within research communities.8
Journal stacking. Publishers bundle less-cited journals with high-IF journals in subscription packages, effectively using the prestige of a few to subsidize the rest.
Predatory journals. The IF system created demand for publication slots at any cost, and an entire industry of fake or low-quality journals (“predatory journals”) emerged to satisfy it, charging APCs and performing little or no real peer review. Estimates suggest over 10,000 predatory journals now exist.
The Numbers Publishers Don’t Advertise
The IF of a journal is heavily skewed by a few highly cited papers. In most journals, the majority of papers are cited fewer times than the journal’s IF, because a small number of landmark papers inflate the mean.
Review articles and methods papers attract disproportionate citations; primary research papers often don’t. A journal can boost its IF by publishing more review articles.
The IF window is two years, too short to capture fields where citation takes longer (mathematics, geoscience, parts of physics).
Humanities vs. sciences: This disparity is enormous. Nature’s IF of ~65 exists because biomedical papers generate rapid citations. A top philosophy journal might have an IF of 1–3, not because the work is less valuable, but because the citation culture and timescales differ completely. Applying IF comparisons across disciplines is methodologically indefensible, yet it happens constantly in hiring and promotion decisions.
Discipline Comparison: Impact Factors Across Fields
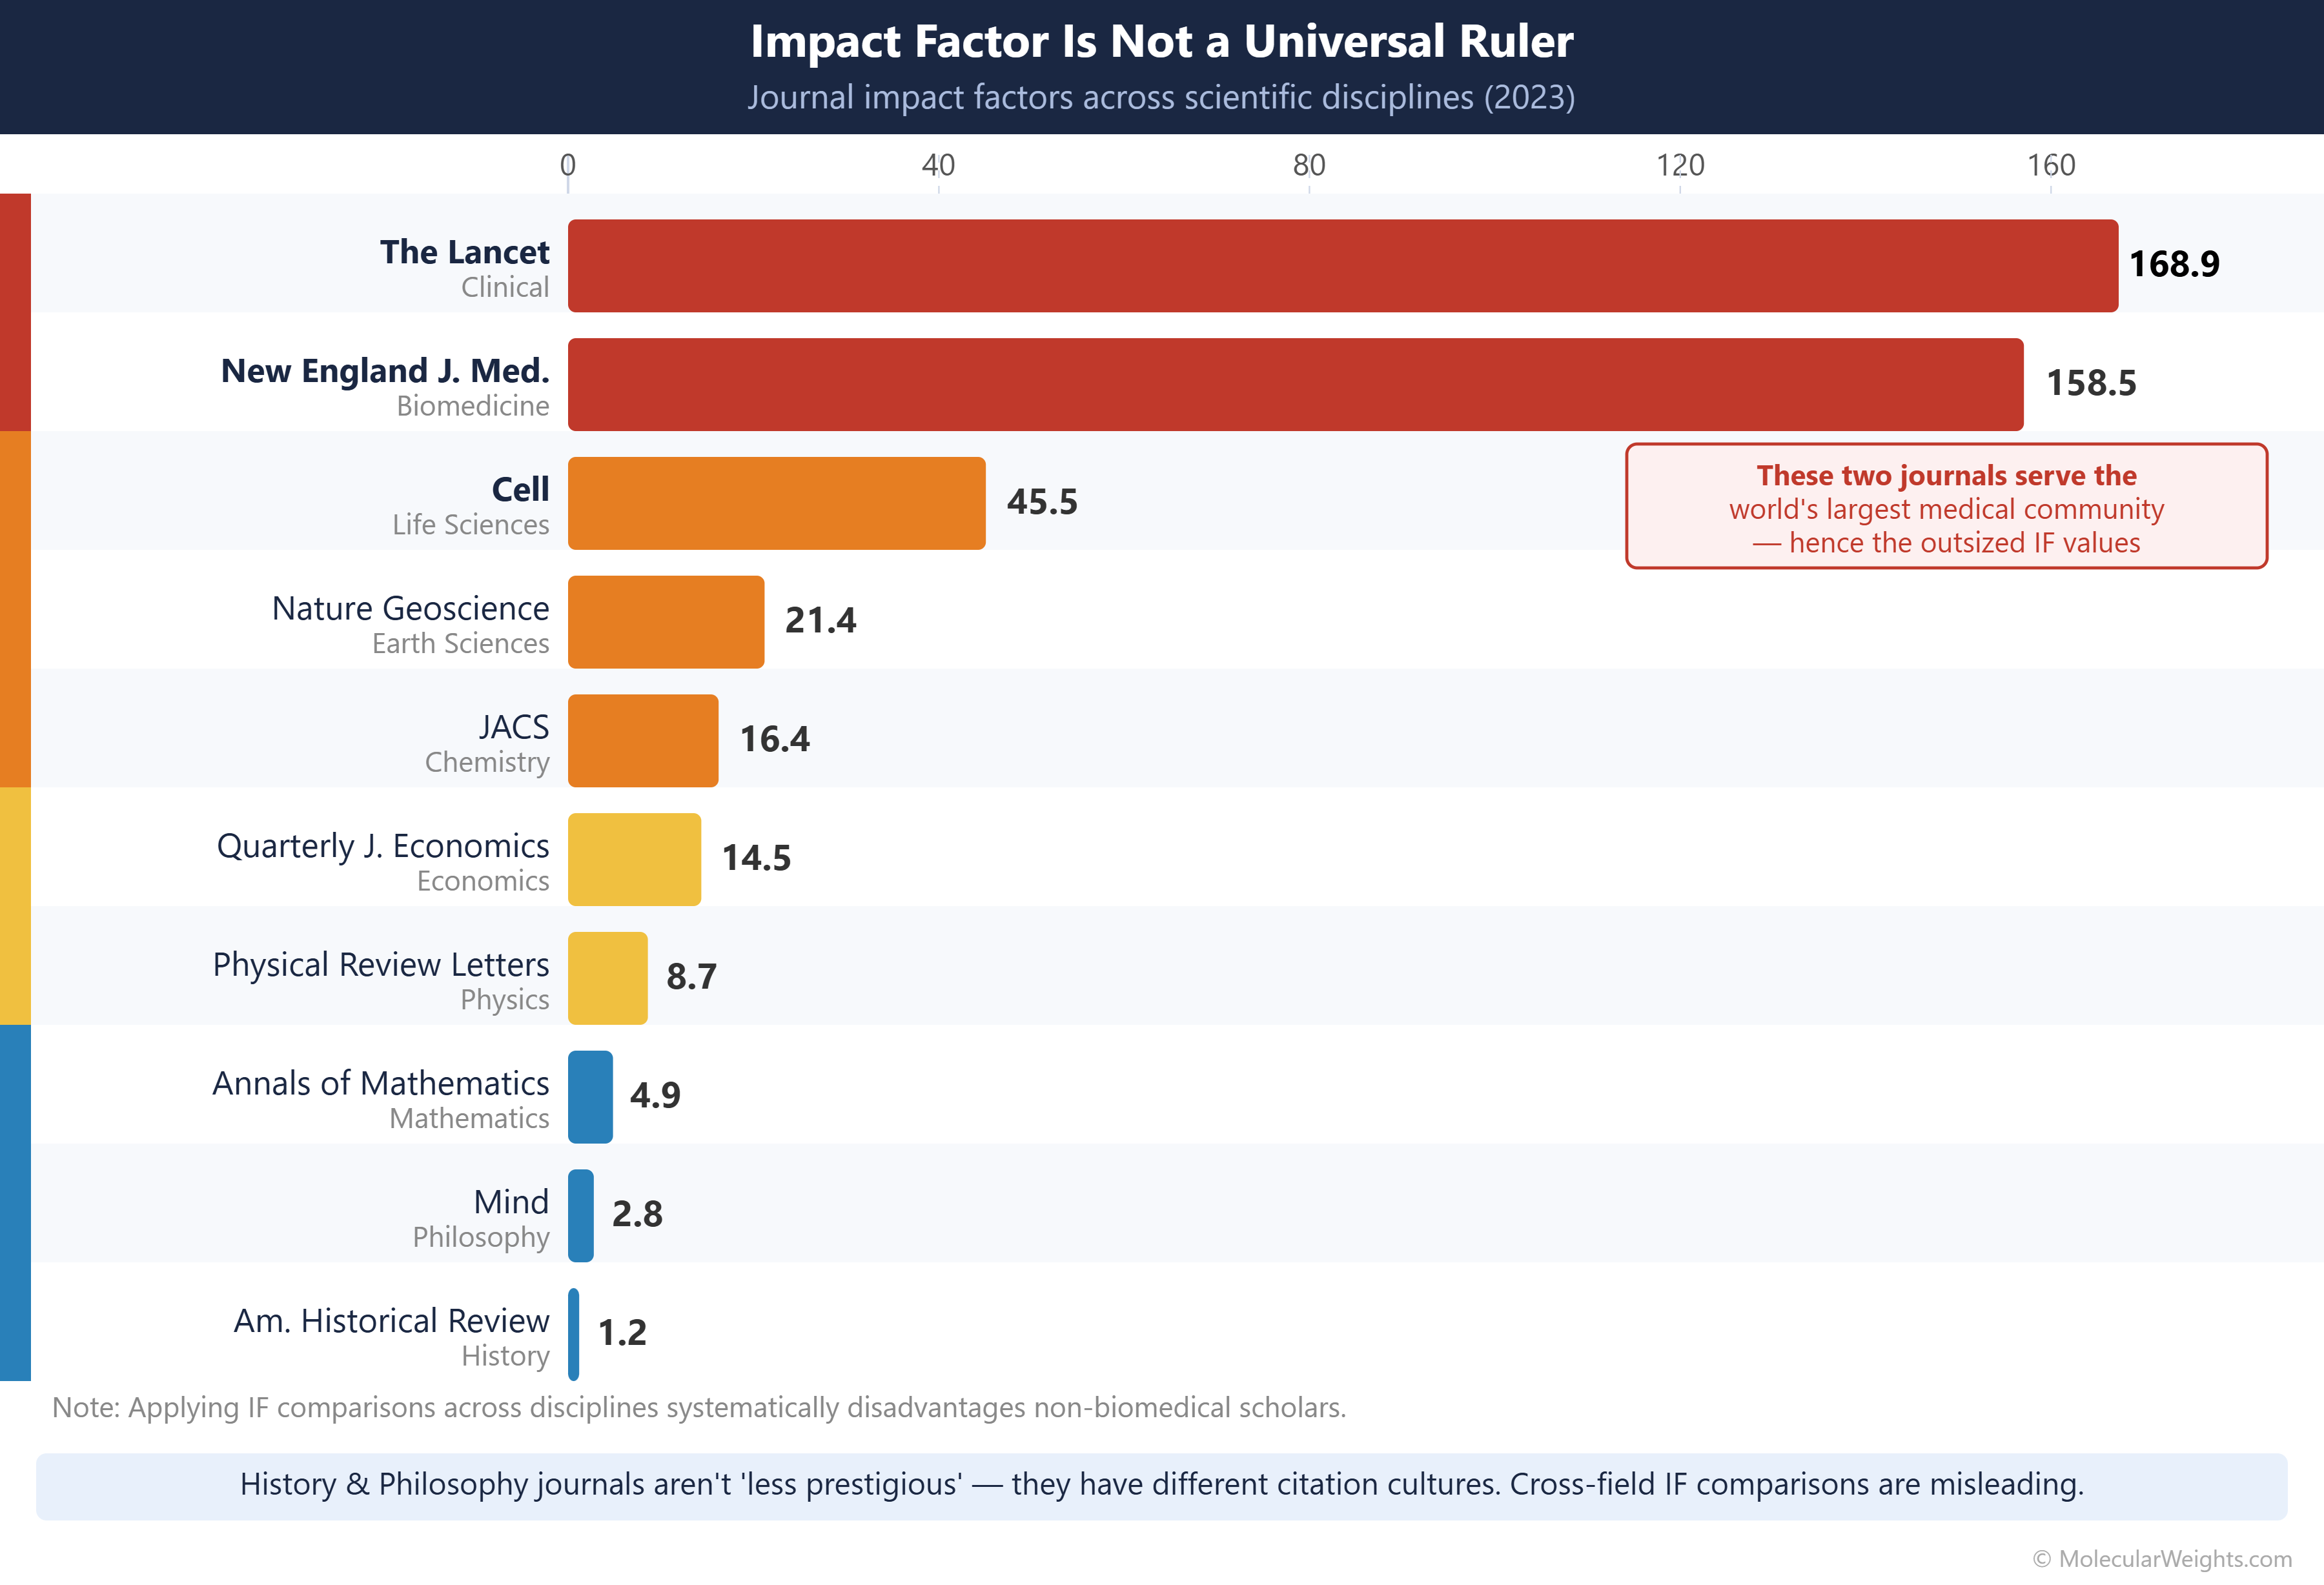
Table 4. Journal impact factors for representative top journals across ten disciplines (2023). Color coding reflects IF quartile within each discipline
A history professor and a biochemist whose departments use raw IF for promotion are being measured with instruments calibrated for different purposes entirely. The biochemist has a structural advantage that has nothing to do with the quality of their scholarship.
Part 5: Publish or Perish (The Career Machine That Feeds the Publishers)
The impact factor would not matter so much if it were not wired directly to the one thing every academic needs: their job.
The Promotion Clock
At a research university, the typical academic career path runs:
PhD (4–7 years): produce publications to get postdoc positions
Postdoc(s) (2–6 years): produce publications to get faculty positions
Assistant Professor (6 years): produce publications to get tenure
Tenure review: committee evaluates publication record: How many papers? In which journals? How often cited?
Tenured Associate Professor: produce publications for promotion to Full Professor
Full Professor: produce publications to maintain grants
At every stage, the metrics that gatekeepers use are publication-based: total papers, journal IFs, h-index (a measure combining publication count and citations), citation counts. These are the currency of academic careers.
A 2025 paper in PNAS by Trueblood and colleagues described the dynamic precisely: “Commercial publishing companies have capitalized on the centrality of publishing to the scientific enterprises of knowledge dissemination and academic recognition to extract large profits from academia by leveraging unpaid services from reviewers, creating financial barriers to research dissemination, and imposing substantial fees for open access.”9
Grant Funding Is Also Tied to Publication Metrics
In the US, National Institutes of Health (NIH) study sections reviewing grant applications explicitly evaluate the PI’s publication record. The National Science Foundation does similarly. In the UK, the Research Excellence Framework (REF), the national evaluation process that distributes government research funding to universities, scores universities partly on the publication output and journal prestige of their researchers.
The result: universities need their researchers to publish in prestigious journals, so universities need access to prestigious journals, so universities pay publisher subscription fees. The same institution simultaneously produces the content and pays to access it.
The h-Index and the Gamification of Careers
The h-index, introduced by physicist Jorge Hirsch in 2005, attempts to capture both productivity and citation impact in one number: a researcher has h-index n if they have published at least n papers each cited at least n times. A researcher with h = 40 has published at least 40 papers each cited at least 40 times.
Like the impact factor, the h-index was introduced as a useful summary statistic. Like the impact factor, it became a career determinant. And like the impact factor, it has well-documented problems:
It accrues monotonically: it can never decrease, even if your recent work is poor
It is strongly correlated with career age (older researchers always outperform younger ones)
It is entirely field-dependent (an h-index of 15 is outstanding in mathematics; mediocre in molecular biology)
It rewards breadth of output over depth of contribution
It can be gamed through self-citation and citation networks
Publishers did not invent the h-index, but they benefit from the culture it sustains, because that culture demands ever-increasing publication output, which fills journal pages, which generates subscription revenue and APCs.
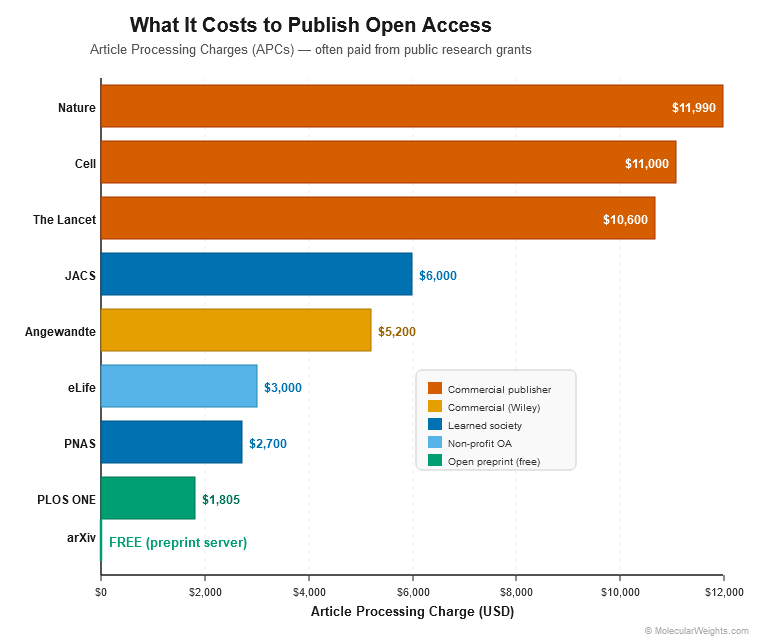
Figure 3. Article processing charges (APCs) at major journals grouped by publisher. Hard-science journals at Springer Nature command the highest fees ($11,990 at Nature). Nonprofit publishers (PLOS, APS) charge substantially less for comparable or greater citation impact. APC inflation has run at approximately 3× the rate of general inflation since 2015 (Khoo, 2019, LIBER Quarterly).
Part 1 ends here. The machine is built, the incentives are locked, and the career penalties for non-compliance are real. But who actually gets hurt when the system runs? Part 2 of this series follows the money further: the library systems pushed to cancellation, the researchers in smaller institutions or developing countries who can’t afford APCs at all, and the reform movements that have spent decades trying to build alternatives. Preprints, funder mandates, diamond open access, blockchain-based peer review — all of them face the same structural obstacle. Part 2 asks whether any of them can move fast enough to matter.
Did You Know?
The entire arXiv preprint server, used by millions of physicists, mathematicians, and computer scientists every day, costs roughly $2 million per year to operate. Elsevier’s annual revenue exceeds that figure by a factor of over 1,500.
Peer reviewers collectively contributed over 100 million hours of labor to academic publishers in 2020 alone. The salary-equivalent value of US-based reviewer time in that single year exceeded $1.5 billion.6
Eugene Garfield, who created the impact factor in the 1950s, explicitly warned that it should not be used to evaluate individual researchers or papers. It was designed as a library collection tool. Hiring committees have disregarded that warning for five decades.7
A single paper in The Lancet costs $10,600 to publish open access. The median annual salary of a postdoctoral researcher in the US is approximately $55,000. The APC is roughly 20% of their pre-tax annual income.
References
Larivière V, Haustein S, Mongeon P (2015). The oligopoly of academic publishers in the digital era. PLOS ONE 10(6):e0127502. doi:10.1371/journal.pone.0127502
RELX Group (2022). Annual Report and Financial Statements 2022. Available at relx.com/investors/annual-reports (Elsevier operates as the Scientific, Technical & Medical division of RELX Group.)
Eddy T (2019). Plan S: Motivations of for-profit publishers. Science 363(6425):350. Google Scholar
Butler L-A, Matthias L, Simard M-A, Mongeon P, Haustein S (2023). The oligopoly’s shift to open access: How the big five academic publishers profit from article processing charges. Quantitative Science Studies 4(4):1181-1204. doi:10.1162/qss_a_00272
Khoo SY-S (2019). Article processing charge hyperinflation and price insensitivity: An open access sequel to the serials crisis. LIBER Quarterly 29(1):1-18. doi:10.18352/lq.10280
Aczél B, Kovacs M, van der Lippe T, Szaszi B (2021). A billion-dollar donation: estimating the cost of researchers’ time spent on peer review. Research Integrity and Peer Review 6:14. doi:10.1186/s41073-021-00118-2
Aronson J (2025). When I use a word… Academic publishing: the impact factor. BMJ 388:q2801. doi:10.1136/bmj.q2801
Juyal D, Thawani V, Thaledi S (2019). Impact factor: Mutation, manipulation, and distortion. Journal of Family Medicine and Primary Care 8(5):1492-1494. Google Scholar
Trueblood JS et al. (2025). The misalignment of incentives in academic publishing and implications for journal reform. PNAS 122(5):e2401231121. PMID 39869806